

17 Charts That Reveal the Astonishing Scale of AI and Technological Change
A deep dive into 25 years of exponential change across AI, compute, robotics, connectivity, and data and what the acceleration actually means for the next decade of work and life.

Last week I did a DEEP DIVE on AI, jobs, and the future of work which drew a lot of comments, attention, and emails.

Today, I want to take a parallel angle to that post and explore just how much AI and technology has accelerated and changed over the past few years and show you the unbelievable scale and pace of change that we are going through. This is another DEEP DIVE article with 17 charts.
But first…
I want you to do something before you read this article.
Think about the year 2000. Really think about it. Not the highlights or the mundane stuff. How you got directions. How you found a restaurant. How you communicated with your team at work. How you took a photo and then waited a week to see if it came out.
If you were alive and working back then, you probably had a desktop computer… maybe. If you were ahead of the curve, you had a dial-up internet connection that screamed at you every time you logged on (it’s how I played Starcarft!) Your phone was either attached to a wall or it was one of those early Nokia bricks that could survive a fall from a building but couldn’t load a webpage (I had one with all of those crazy lights). There was no iPhone. No Google Maps. No Spotify, Netflix streaming, Uber, Zoom, or Slack. The concepts of “the cloud,” “machine learning,” and “generative AI” would have sounded like science fiction.
That was 26 years ago. One generation.
And here’s what I’ve come to believe as someone who has spent my entire career studying how technology reshapes work, organizations, and leadership: most of us, including the executives paid to anticipate the future, dramatically underestimate how much has changed.
We suffer from what I’d call “the normalization of the extraordinary.” Because the changes happened gradually. A new phone here, a faster connection there, a new app that made something slightly easier, we adapted in real time and lost the ability to see the cumulative picture. We’re like the person who sees themselves in the mirror every day and can’t tell they’ve aged. But if you showed them a photo from 25 years ago, they’d barely recognize themselves.
This article is meant to be that photo.
I’ve pulled together data from Epoch AI, Stanford’s AI Index, the St. Louis Federal Reserve, the International Telecommunication Union, Crunchbase, and more to build 17 charts that capture the true scale of the transformation we’re living through. Some of these numbers are so large they stop making intuitive sense. That’s kind of the point.
But I don’t just want to show you data. I want to show you what it means. Because the gap between the pace of technological change and the pace at which most people and organizations are adapting is the single biggest risk we’re not talking about enough. And the data I’m about to show you makes it clear that this gap is accelerating, not closing.
Let’s start at the beginning.
The Infrastructure Revolution
Every transformation in human history has required infrastructure. The agricultural revolution required irrigation. The industrial revolution required railroads and factories. The digital revolution required two things: billions of people connected to a global network, and machines powerful enough to do something useful with that connection.
We built both, at a speed and scale that has no precedent.
The World Came Online
In the year 2000, roughly 361 million people on Earth had access to the internet. That’s about 6% of the global population. Most of them were in North America, Western Europe, and parts of East Asia. For the other 94% of humanity, the internet was either unavailable, unaffordable, or irrelevant to their daily lives.
Today as of the ITU’s most recent data, approximately 6 billion people are online. That’s 74% of every human being alive.
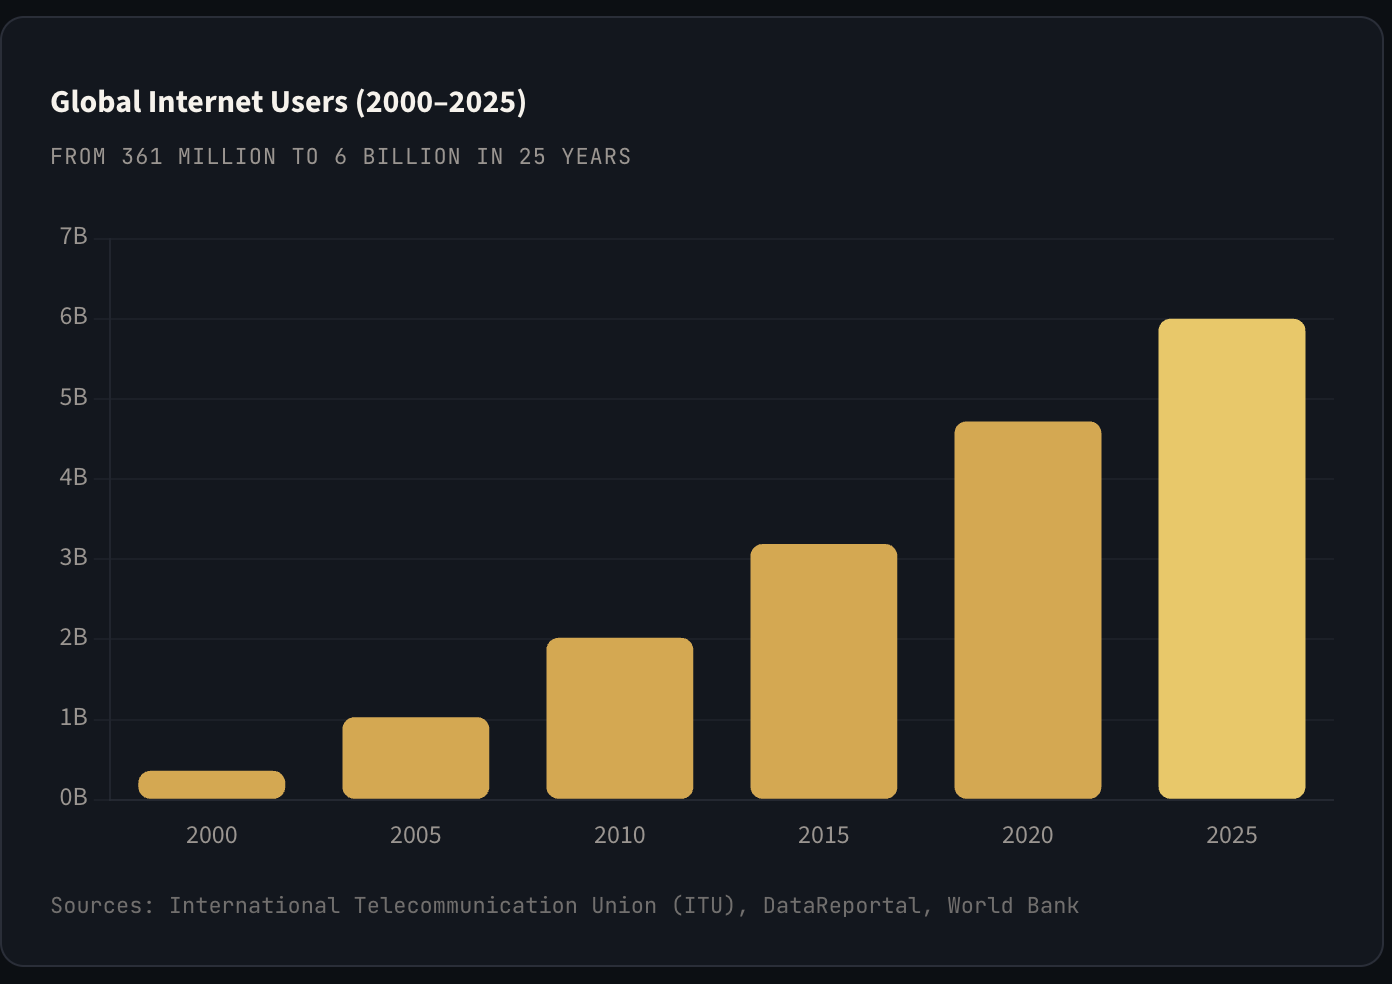
We added 5.6 billion internet users in a single generation. To put that in human terms: the entire population of the world in 1900 was about 1.6 billion. We connected almost four times that many people to a single global information network in roughly the same amount of time it takes to pay off a mortgage.
And we’re not done. As of early 2026, about 2.2 billion people remain offline, disproportionately concentrated in Sub-Saharan Africa and South Asia, where internet penetration is still below 40%. The next wave of internet users will fundamentally reshape markets, labor pools, and consumer behavior in ways most Western companies aren’t yet planning for.
Every business strategy, every organizational design, every assumption about your addressable market implicitly depends on a certain level of connectivity. When 74% of the planet is online, the total addressable market for digital products and services has expanded by a factor of 16 since 2000. If you’re still thinking in terms of “our domestic market” or “our traditional customer base,” you’re thinking inside a box that no longer exists.
The Smartphone Explosion
But getting people online was only half the connectivity story. The other half was putting a supercomputer in their pocket.
When Steve Jobs introduced the iPhone in 2007, there were approximately 120 million smartphones on Earth. As of 2025, that number is 7.4 billion — more smartphones than there are people on the planet (some estimates today have that this at over 8 billion). Roughly 87% of all mobile phones in use today are smartphones, and about 63% of all internet traffic now flows through mobile devices.
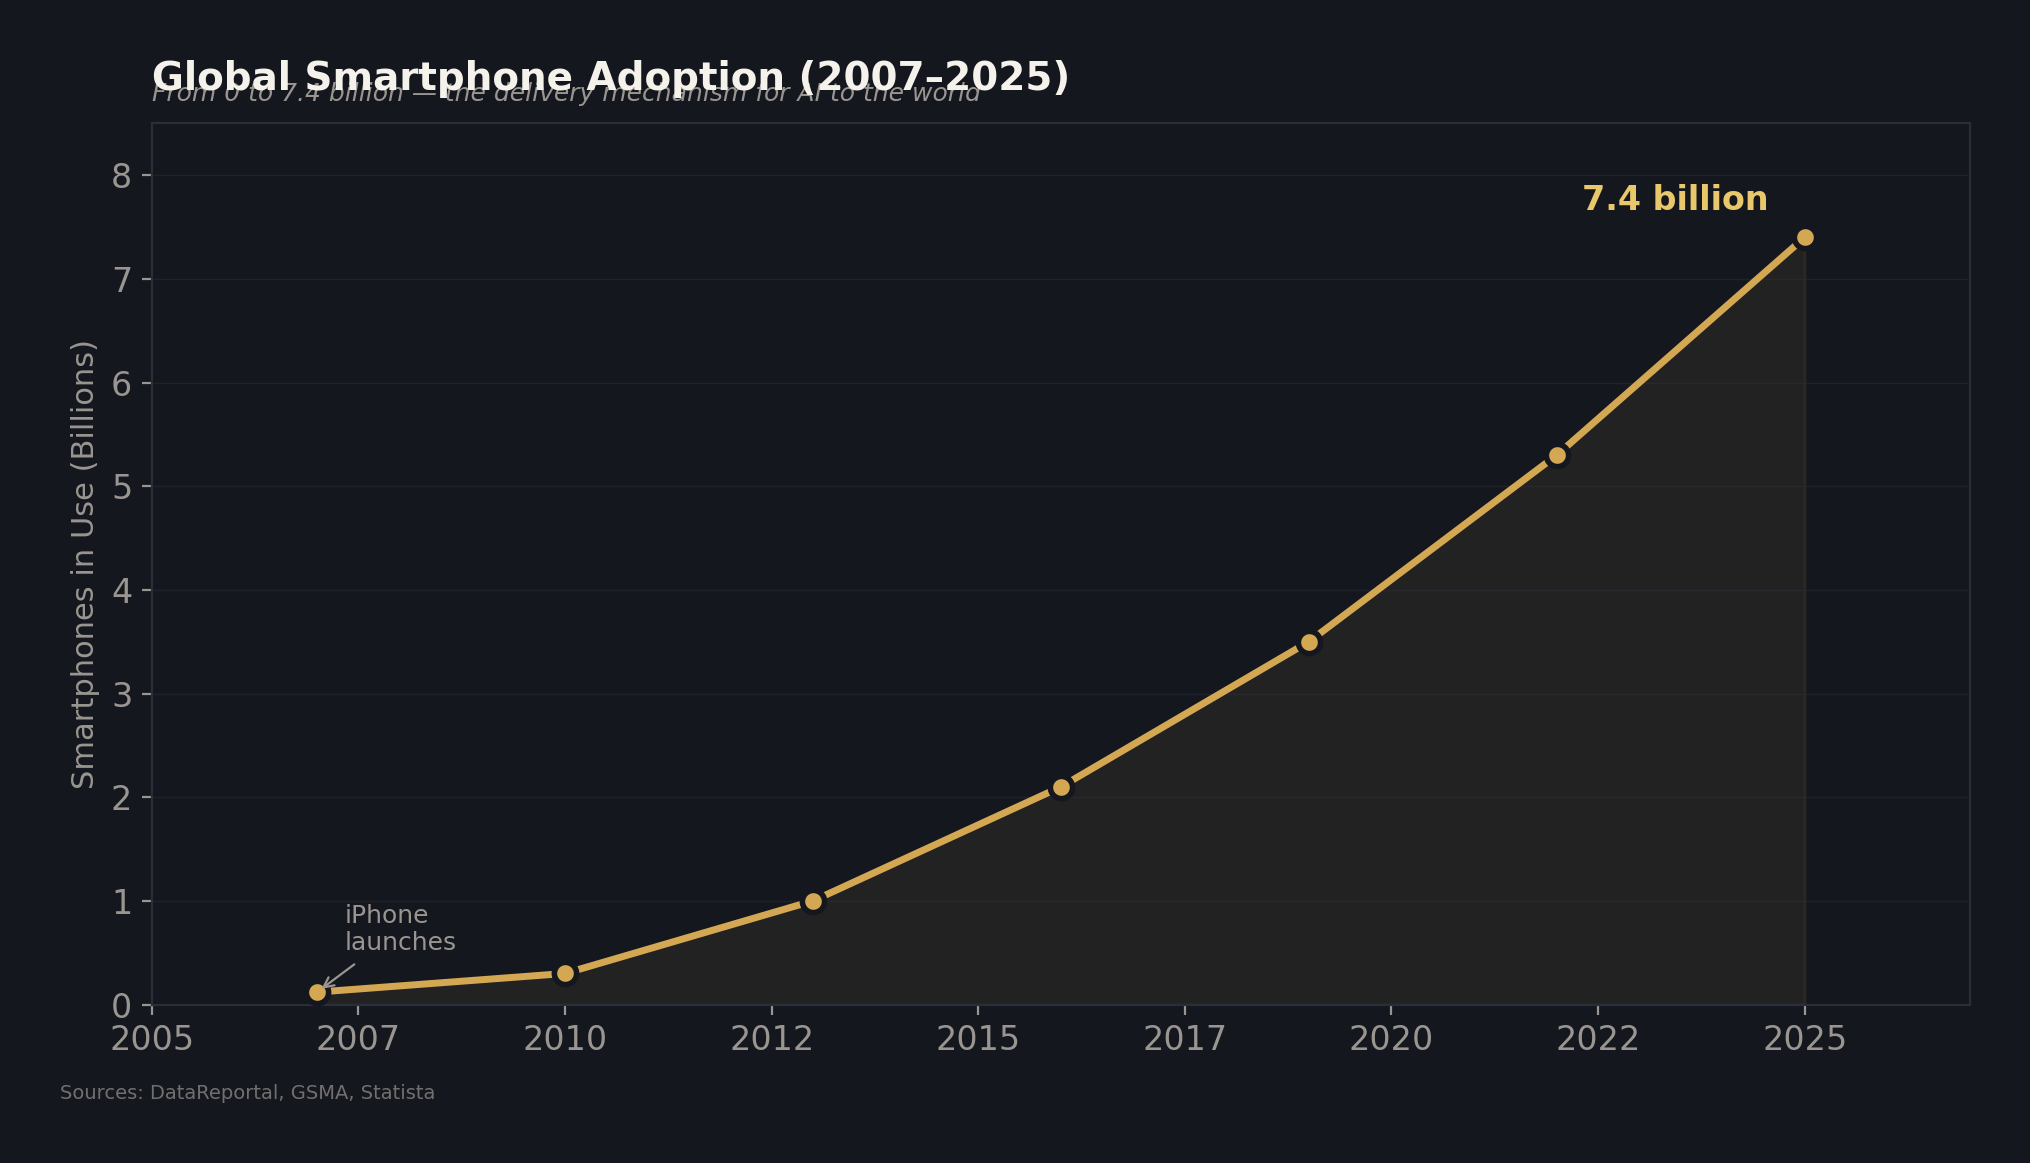
This matters because the smartphone is the delivery mechanism for AI to the world. When ChatGPT launched in November 2022, it didn’t require anyone to buy new hardware. Billions of people already had a device in their pocket powerful enough to access it. The infrastructure was already built. The runway was already paved. AI just needed to show up and show up it did.
Moore’s Law — Six Decades and Still Going
In 1965, Gordon Moore, co-founder of Intel, made an observation that would become the most famous prediction in the history of technology. He noticed that the number of transistors on a computer chip seemed to double about every two years. He predicted the trend would continue.
Sixty-one years later, it’s still holding.
If you’re not an engineer, here’s the simple version: a transistor is the fundamental switch that makes a computer think (I’m learning more about these as my 5 year old son is obsessed with electronics). More transistors means more computing power. In 1971, Intel’s first microprocessor, the 4004, had 2,300 transistors. As of early 2026, Apple’s M3 Ultra chip contains 184 billion transistors, and NVIDIA’s GB202 graphics processor packs over 92 billion on a single die.
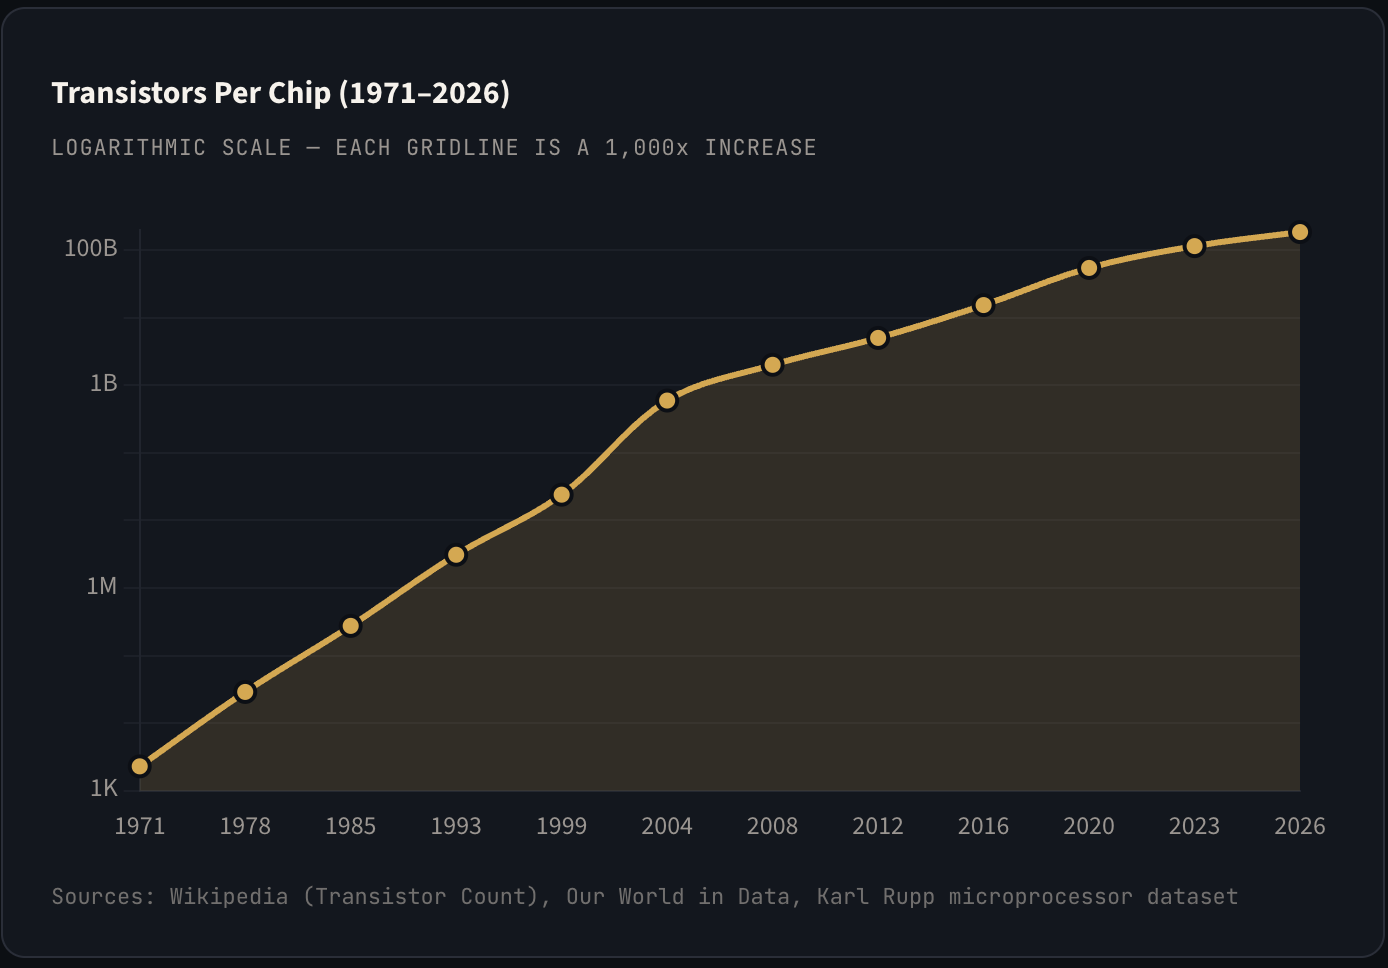
This chart is shown on a logarithmic scale. Each step on the vertical axis represents a thousand-fold increase. The fact that the data points form a nearly straight line on this scale tells you something remarkable: exponential growth in computing power has been sustained, with striking consistency, for over half a century.
Many people have declared Moore’s Law “dead” or “dying” over the years. The physics of shrinking transistors does get harder. But the semiconductor industry keeps finding new approaches with things like FinFET transistors, 3D chip stacking, extreme ultraviolet lithography, gate-all-around architectures, etc that sustain the trend even as the easy gains disappear. Intel has announced a roadmap to reach 1 trillion transistors on a package which is just mind boggling. TSMC is producing chips at the 2-nanometer node which is around the size of a molecule or the width of DNA.
Moore’s Law isn’t just a semiconductor industry factoid. It’s the engine underneath everything including every new capability in AI, every new consumer device, every improvement in cloud computing. When computing power doubles every two years and the trend has held for six decades, it means the next two years will deliver as much improvement as the last two, which already built on the previous two. The compounding effect is staggering. What feels “cutting edge” today will feel quaint by 2028.
The Chart That Explains Everything
If I could show you only one chart to explain why artificial intelligence is exploding right now, why it didn’t happen in the 1990s or 2000s, even though many of the underlying mathematical ideas existed, it would be this one.
